A Guide to Using Expected Goal for Dummies
A field guide to using expected goals safely in the real world

Last week, I finally got on the horse and wrote again. It felt good just getting some ideas on paper, metaphorically speaking of course. This momentum led me into thinking more deeply about the game over the course of the week, especially about expected goals.
Over the last few years, the hockey world has come to accept expected goals. Pretty much every professional team has at least one source of expected goals that they use, the media has started referencing it (including on-air during the Stanley Cup Final!), and fans have continued to use it. There was no clear point of adaptation, but it feels like we have hit a milestone.
With this the wars surrounding their usage seemed to have hit dormancy or have maybe gone extinct. There will always be detractors, but there are very few left with any credibility. In my opinion, that has reduced the conversation around the nuances of expected goals.
That’s not to say that the topic has left the minds of others. The other day, someone asked me about the differences between the major public expected goals models that were spitting out different results in the same game. Luckily, Alison Lukan and Shayna Goldman had excellent articles publicly available already here and here.
Luckily, I think there is a lot out there on expected goals models, what they are, and how they are built. However, there isn’t much available on how to use expected goals to gain actionable insights or form hypotheses about the future.
For those who don’t know, my day job is in real estate finance where I work in more of a consultancy type of role. In a nutshell, similar to what I do in hockey, I use data to gain insights from past performance as well as create forecasts for future performance. With this, I share my insights directly with my clients’ CEO’s and CFO’s. Through this, I’ve learned the importance of simplification and illustration in the communication of the facts, narratives, and conclusions.
For this exercise, I will break the relevant topics surrounding expected goals in different sections and wrap it all up at the end.
Not all expected goal totals are created equal
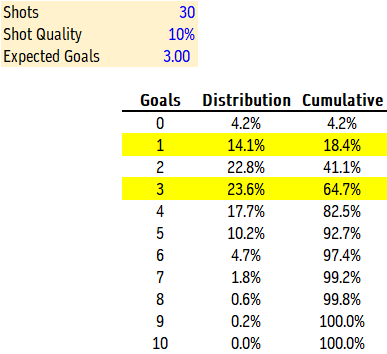
Expected goals are the sum of all of the probabilities of each shot becoming a goal. If a team took 30 shots each with a probability of becoming a goal at 10%, then the expected goals would be 0.1 + 0.1 + 0.1… + 0.1 = 3.
That’s great, but we only scored one goal. Sounds like the model is off, right? Well actually, the model may be spitting out 3 as the expected goals total, but in this scenario, we would only expect to actually score 3 goals 23.6% of the time. We’d expect to be held to a single goal 14.1% of the time.
In real life, the opposing goalie may have played out of their mind. Or perhaps our shooters were just sending it straight into the goalie’s pads. It’s something that we can actually feel and explain. When things are going your way and you’re outscoring your expected goals, it feels great. And when you can’t seem to find the back of the net, it feels awful. In stats, they just call that variance.
Regardless of why, as the coach, you walked away from the game frustrated. Your players were being too cute with the puck. Next game, they have to get more shots on net, even if they sacrifice the quality of shots in the process.
So, the next game, the quality of your shots goes down from 10% to 5%, but you doubled your shot total. Surely you won’t be held to one goal again, right?
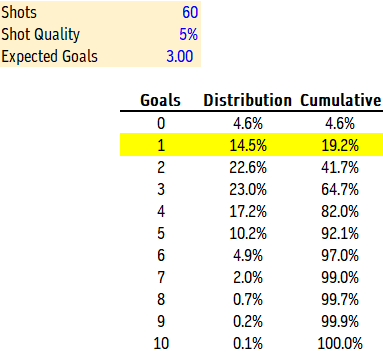
Actually, you’ve increased your odds of scoring only one goal, going from a 14.1% probability to 14.5%. It’s very counterintuitive, but very real. By taking more shots at a lower quality, you are introducing more variance. You are more likely to score 6 goals now, but also more likely to get shut out.
The funny part about this is that in each scenario, there is a 35.3% likelihood that you score 4 or more goals, but in the scenario with 30 shots there is a 41.1% chance that you score 2 or fewer while in the 60 shots scenario there is a 41.7% chance. This additional variance only has negative effects!
From a coaching perspective, this exercise shows the value of prioritizing shot quality over shot quantity. Passing up on perimeter shots for fewer, higher-quality opportunities, we can use the power of math to gain an advantage.
The path from shot attempt to expected goal can be unstable
Back at the start of hockey analytics, there was only shot attempts (corsi), unblocked shot attempts (fenwick), shots on goal, and goals. Corsi was the most used stat by the analytics community because it offered the largest sample size to work from, which has some benefits. The most important being that it stabilizes much quicker than goals and shots on goal, offering clearer insights into the future much quicker. But the rightful argument against its usage was that it treated all shot attempts as equal. A dump-in on net from the neutral zone was treated the same as a rebound from point blank.
At its core, expected goals is a weighted corsi, with the weights being derived from a model that attempts to determine the likelihood of a goal on a shot-by-shot basis. Side note, but very important, expected goals models in the public sphere only use unblocked shot attempts (fenwick) because the NHL does not record the shot location of blocked shots.
I find this framing to be important. If we treat all shots as equal, then our expected probability of scoring on any given shot attempt would be the league average shooting percentage. In the NHL this season, the league average shooting percentage on all shot attempts at 5v5 is 4.3%, or 0.043 expected goals.
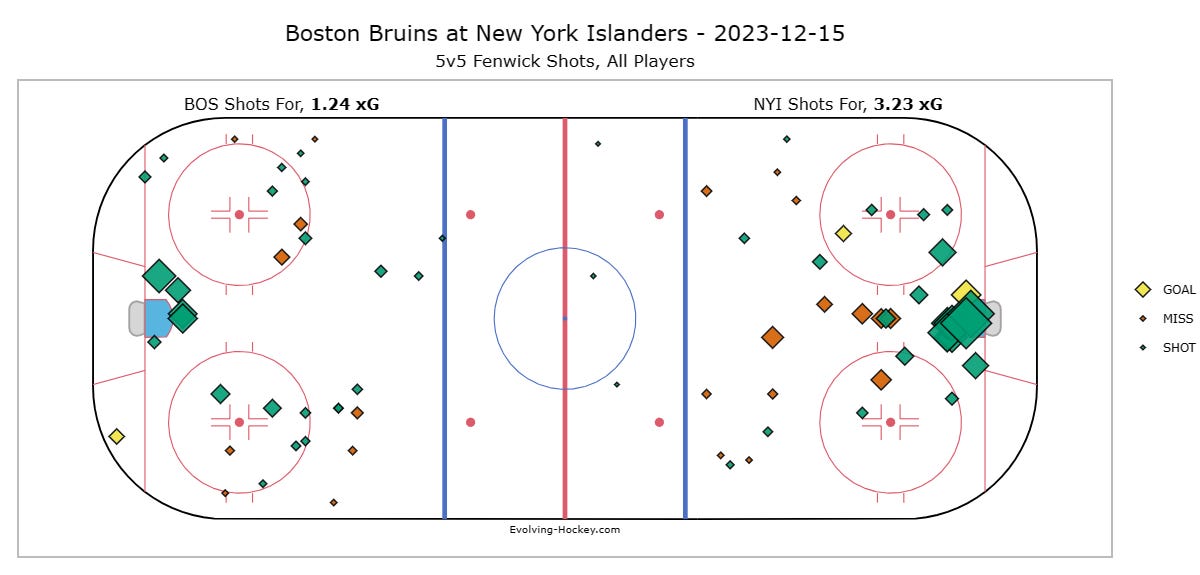
Let’s take the following sequence from Friday night’s game on Long Island.
The initial shot from David Pastrnak comes from distance (45 feet) and an angle (24.9 degrees). Watching the video there was some traffic that may have made the save more difficult, and we’ll get to that topic next, but historically speaking, this shot is not dangerous. The expected goals model gave it a 1.3% chance of becoming a goal. Therefore, corsi assigned this shot 0.03 more expected goals than the model felt it was worth (0.043 - 0.013 = 0.03).
The rebound opportunity from Geekie was from in close (recorded at 9 feet) and from the other side of the ice, forcing the Islanders goaltender to move quite a bit in short notice. This opportunity was seen as dangerous, with the model giving it a 20.4% chance of becoming a goal. Therefore, corsi assigned this shot 0.16 fewer expected goals than the model felt it was worth.
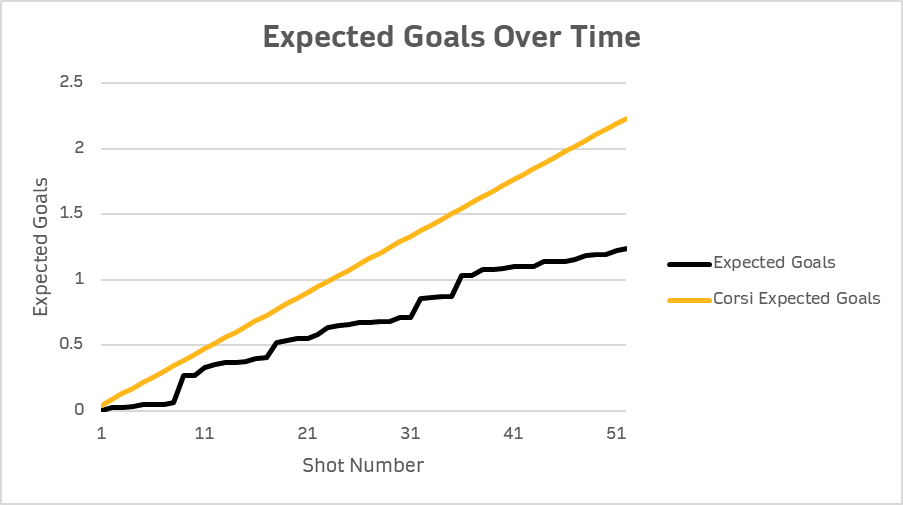
Over the course of the game, there was a dramatic difference between the expected goals model and the corsi-equivalent. This was driven by the fact that the Islanders blocked 18 of the 52 shot attempts (34.6%) and that the Bruins were taking shots primarily from the perimeter. In fact, the Geekie rebound attempt was marked as the most dangerous shot attempt.
Over the course of the game, this is a plausible result. However, over a longer period of time, like a season, we wouldn’t expect to see such a deviation between the two. The league average rate of blocked shots this season is 28.5%, much lower than the 34.6% in this one game. The Morgan Geekie shot was also the only rebound attempt of the game. Over time, we’d expect that rate to go up. Plus, we’ll probably be able to find better shots to take too.
Players and teams have an impact on the quality of shots that they take and allow. However, the difference between corsi and expected goals can be unsustainably wide in smaller sample sizes that consist of less than 500 minutes. We should expect the two to be much closer as we play more games.
Data quality is better, but still has inconsistencies
Another battle fought a few years ago was over the quality of data that the NHL provides. This argument typically arises when weighing metrics from the public analytics sphere against metrics displayed from the private sphere. Just like the argument against corsi, I find this to have some validity.
After the opening faceoff in Saturday night’s game at TD Garden, Mason Lohrei iced the puck.
For some reason, Patrick Brown was credited with a tip from 7 feet out. Of course, given that it was icing, no Bruin touched the puck from the red line on in, so how would there have been a shot attempt recorded?
This is certainly a mistake of some kind, but it had its impact on expected goals. A tip from the low slot is a dangerous shot. The expected goals model gave it a 19.9% chance of becoming a goal, which was the eighth most dangerous shot attempt all night.
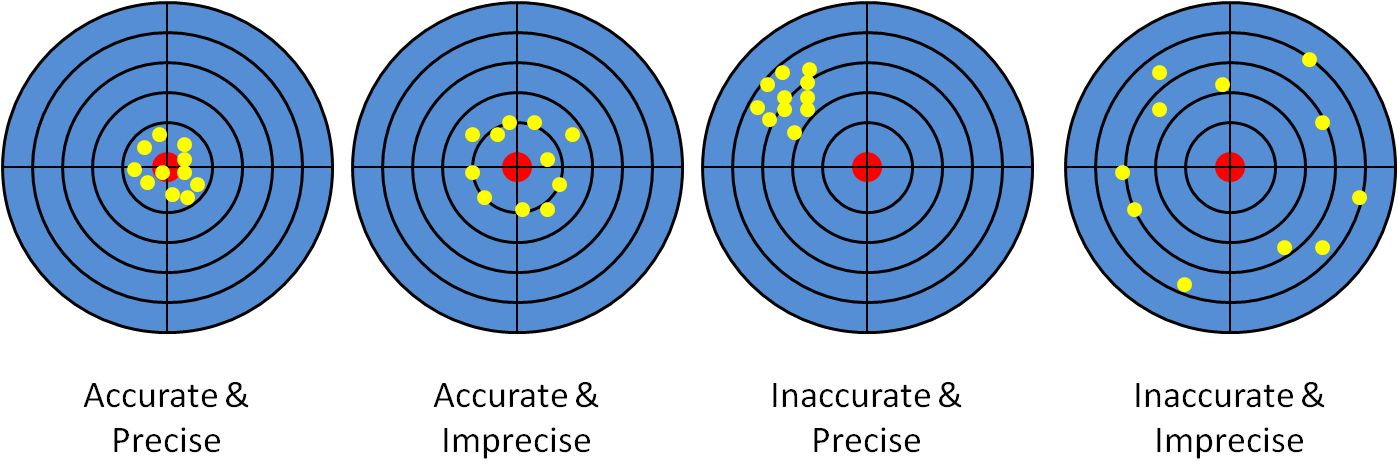
NHL data is accurate, not precise. In general, we use these two words interchangeably, but that’s not the case in a scientific context. Accuracy has to do with the proximity to a particular target while precision has to do with the ability to repeat that proximity time and time again.
If there was somehow an error in the backend system that was placing shots farther away from where they were recorded, which has happened before, that would be an example of precision with inaccuracy. Ultimately, there is a margin of error in the NHL’s data. One shot may be recorded 10 feet farther away than it actually occurred while another is 5 feet closer. Over a larger sample, these things tend to even out, but in a small sample, they can have an impact.
For Brown, who has been up and down from the AHL and plays fourth line in the games that he actually plays, this nonexistent shot has a larger impact on his stat line. His total individual expected goals went from 0.37 to 0.57 (+54.1%), or from 2.47 to 3.42 at a per 60 rate. Compare that to his shot attempts that only went from 9 to 10 or 8.57 to 8.85 on a per 60 basis.
Conclusion
At the end of the day, expected goals is a great metric. It offers much needed context to corsi, fenwick, and shots on goal. However, it’s not a fool-proof metric either. The contents that make up the expected goal total you come to see matter a lot, whether it’s the quality of shots, quality of the data, or just randomness that lives in the game.
When using expected goals:
Be wary of the contents that make up the total. Check the expected goals versus fenwick.
If there appears to be a big difference between corsi and expected goals, check for the percentage of shots that are blocked. Over 30% and under 26% is unsustainable in the long run.
Keep in mind your sample size. It takes between 15 and 25 games to gain any insight on the team level, so triple that for individual players.
For many, Moneyball was the first example of sports analytics in professional sports that they witnessed. Unfortunately, the film did a terrible job illustration how to use analytics in real life. No general manager is pointing at some nerd to give them a player’s on-base percentage and making decisions off of that. Analytics are an entry point to deep research in order to gain insights others don’t have. Analysis doesn’t stop at the numbers, it starts there.