Getting Ready for 2023-24: Part I
My tracking project overview for the coming season

Last season, I tracked all of the Bruins entries, exits, shot assists, and unblocked shots at 5-on-5. I wrote about it extensively, including reviewing my own work and what I could improve upon for this upcoming season. After spending time relaxing, thinking, and tinkering, I now have my process for the 2023-24 season solidified.
I am writing this for a couple of reasons. For one, I [now] see the potential for this to be beneficial for others. Last October, when I was trying to figure out what to present on at the Seattle Hockey Analytics Conference, Alison Lukan pointed me towards sharing my process for tracking games with a lightning talk. That was not at all what I wanted to present on - I never even thought anyone would be interested - but Alison was right, as usual. I had people reach out to me afterwards, either at the conference or on Twitter, telling me they took inspiration from my project and would or did start one of their own.
For those who want to go down that path, as I warned in my presentation, you need to have a reason for doing it and enjoy the process (to some extent). For me, I write this blog and put hundreds of hours into tracking games because it’s the way I enjoy consuming the game. Yes, it’s weird.
The other reason I am writing this is to offer transparency and validity to my data tracking process. I find that it is my responsibility to do this in order for the reader to come to their own conclusions of my process, or to better understand and analyze the data that I release.
The Thesis
Before we get into the dull stuff, let’s talk about my overarching view of the game and why collecting this data is important for that. In 2022-23, both the Florida Panthers and the New York Islanders finished the regular season with a goal differential of +32. But ask anyone and they will tell you that those two teams are extremely different!


Using analytics such as Evolving Hockey’s RAPM, we can parse out high-level themes. The New York Islanders had slightly above-average goal scoring and exceptional goaltending at even strength, while the Florida Panthers had exceptional goal scoring and average goaltending at even strength. We can even dial it in a little bit further and mention that Florida’s exceptional goal scoring was driven by shot creation as opposed to finishing.
This is useful in the arena of evaluating a wide range of teams and players from around the league, but when following one team closely, it is limiting. Something that I enjoy about hockey is that offense and defense aren’t isolated states. You aren’t just playing defense in your own zone, and you aren’t just playing offense in the other team’s zone - at least in the traditional sense.
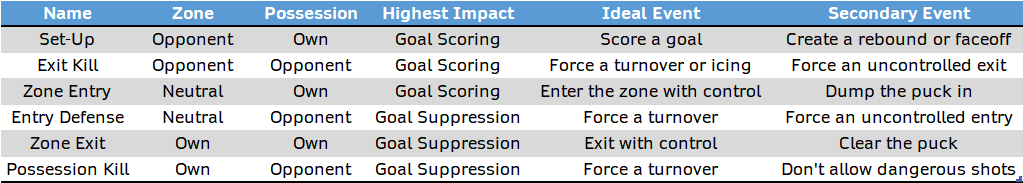
Above are the six states of hockey based on who has possession in which zone. I made sure to omit the words offense and defense. In a sport like football or basketball, the team with possession is making plays that are impacting their chances of scoring more than their suppression of the opponent’s scoring. Because of the blue lines and center ice line, there are two states in hockey in which you are playing offense (affecting goal scoring) or defense (preventing goals against) with the opposite possession.
This is a bit oversimplified, but here is an illustration of how each of the six states of the game feeds to the big-picture numbers we see.
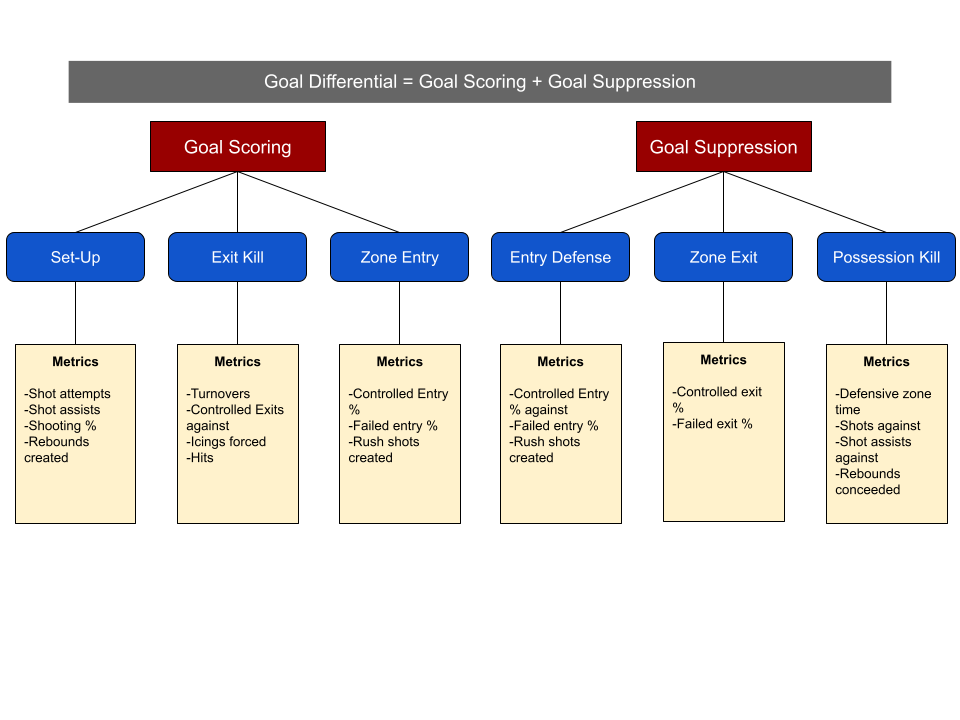
Every tiny event feeds up into the big picture of winning at the end of the day. My goal is to illustrate that through the use of different bits of information, including quantitative metrics. Given the lack of easily accessible data this granular, it is up to me to collect the data myself.
Tracking Project Details
My tracking project can be broken up into two parts: transition and passing. For transition, my tracking definitions are attached here, and my tracking template as it stands is attached here.
In summary, the events that I am tracking from the Bruins standpoint are as follows:
Zone exits
Zone entries
Zone exits against
Zone entries against
Faceoff wins
Faceoff losses
You may be asking yourself, “Why would you track faceoffs when the NHL already has this?” It’s an easy thing to track, and I thought it would give me good reference points when I go back through my data to either record the time events occurred, or to make sure the game clock on the screen matches the actual game clock. The way I will offer some unique insight is by recording them based on who wins possession as opposed to which side of the dot the puck goes.
For each zone entry and zone exit, they will be categorized as either controlled, uncontrolled, or failed. For controlled entries and exits, they can either be passing entries/exits or skating entries/exits. This is much more about assigning proper credit to who is doing the most work on the entry or exit, and the way I record the uncontrolled and failed exits will also line up with this player.
If you take the time to scroll through my definitions, you will find that I have a few other events listed under entries and exits: lucky exit, dump-and-change, and takeaway. These are here to allow me to keep track of zone time more than anything else.
For the passing section, my definitions are here. In summary, the things I am tracking are:
Shot assist (player and location)
Creation type
Cycle
Faceoff
Forecheck
Rush
Off the pass v. Off the stick
Puck recovery
Off the pass versus off the stick is a solution that I came up with for a bit of the subjectivity of one-timers. The image that pops into my head when I hear the word one-timer, is Alex Ovechkin ripping a slapshot from the right dot off of a pass from a teammate. However, corralling a pass to be able to take a wrist or snap shot within a second should have a similar effect. By changing this up slightly, it increases the frequency of the event, casting a wider view on what I am looking for - the goaltender not being able to set up after the pass.
Puck recovery is a completely new thing that I am tracking, and it’s something that I am excited about. I had previously written about rebounds on this blog where I took shot attempts within three seconds of a shot attempt as a proxy for rebound shots and creation. This does a great job at capturing the most impactful puck recoveries following a shot attempt, but not everything. Recovering a shot on the boards will be a much more frequent event and is important to establishing zone control.
Rink Geography and Terminology
It seems as though everyone has their own sense of rink geography, or how they split up the ice. I’ve never been a huge fan of the home plate area, nor am I a fan of any sort of angled zone. It just makes things more complicated. This is not drawn to scale, but here are my zones - for the season at least.
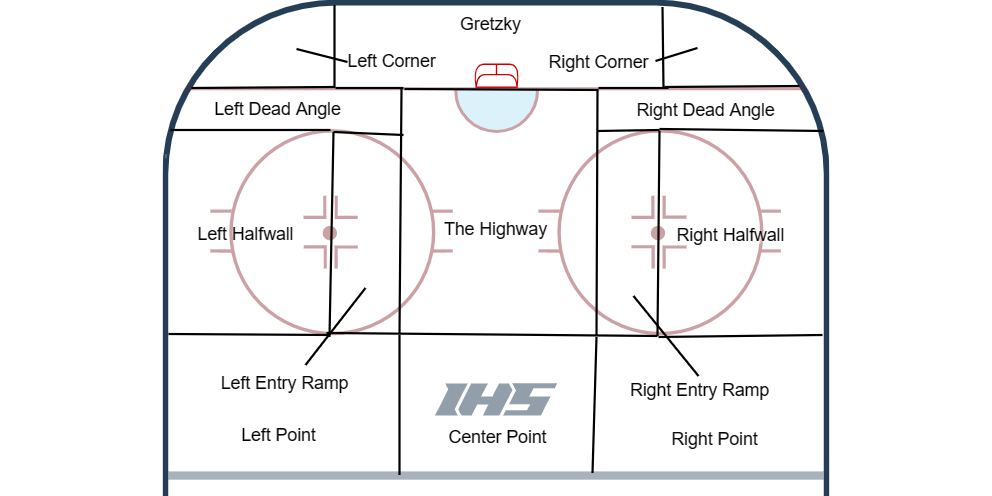
The Highway - The middle 20 feet of ice below the faceoff dot. The best mark of the outer bounds would be the point at which the trapezoid meets the goal line, but that’s not exact. This 700 square foot piece of ice made up 118 of the Bruins 199 5-on-5 goals (59.3%) last season despite only making up 985 of 2,785 unblocked shots (35.4%). This also makes it the best geographic spot for scoring chances in my opinion.
The Entry Ramps - The space between the dot lines and the inner 20 I will refer to as the entry ramps. This is 12 feet wide by 30 feet long on each side of the ice. Ideally, you’d like to move inside from here to create a more dangerous shot, and if you move too far down, you lose too much net for a decent shot. Shots from here need some pre-shot movement or a good screen to be scoring chances here.
Dead Angle - The 32.5 by 5 feet of ice on each side of the ice could also be categorized as the desert. There isn’t much offense to be created here, and usually the puck gets move out of this area quickly.
The Halfwall - The space between the entry ramps and the boards is called the halfwall. The inner portion can be used for one-time chances off of a long pass from the point or other side of the ice, but this is primarily a playmaking area,
The Point - Everything between the top of the faceoff circles and the blue line is referred to as the point. Most view the point to be a bit farther away from the net, but shooting percentages have dropped off quite a bit by this point that I don’t think it matters.
The Corner - It goes without saying that the corners are in the corner of the ice below the goal line. This is primarily a playmaking and puck recovery spot.
Gretzky - I had to add one more themed name. The center area behind the net is a very advantageous area of the ice to make plays.
Beyond the rink geography, I’ve decided that this is the season I am fully committing to referring to defensemen as backs. Ryan Stimson attempted to popularize this a few years back, but the reason for the name change is simple: defensemen aren’t just defensive players the same way forwards aren’t just attacking players. The term back more accurately reflects their position, especially in the modern NHL where backs are more involved in offensive tasks such as rush offense.
New Metrics and Places of Study
With my tracking being much more expansive this season, it offers the opportunity to utilize even more metrics. I will be tracking all strengths this season, which vastly expands my area of evaluation. Additionally, now that I am tracking time with my transition events, I can link events and combine the data with the NHL’s play-by-play to add statistics such as shots per entry or measuring the efficiency of turning a zone exit into a zone entry.
Something that I would like to look at around the turn of the calendar year is shift stacking, or zone stacking. I’m not sure what the best word for it would be, but the idea would be to look at how re-entering the offensive zone after extended zone time may affect the game. How is shot quantity and quality affected? Is the defensive team less likely to mount a transition against you?
Another thing I would like to have handy over the course of the season is some team-level monitoring capabilities like I proposed four years ago at RITSAC. I remember there was a point last season - around the end of January or so - where the powerplay could not enter the zone with control. It would have been quite the ad-hoc project for me at the time to pull up some information on it. I’d like to have that ready with a few lines of code this season.
If you are not subscribed, I highly recommend doing so. I don’t intend to paywall any of my writing, it will just ensure that you can find my content weekly.
This upcoming season certainly won’t come close to the joy of a 65-win record-breaking season, but hopefully it can bring us some fun.